City Disinvestment in Neighborhoods
We previously refuted these claims in our 2020 study.
More recently, we examined trends of neighborhood funding since the City's takeover of the NRP program in 2011. Our analysis of annual allocations and annual expenditures reveals a troubling pattern of disinvestment in the most diverse and low-income neighborhoods of Minneapolis. This disinvestment is happening at several levels.
Analysis of neighborhood funding allocations from the 20 years of the NRP program and the 13 years of Community Participation Program funds and Neighborhoods 2020 funding shows that this disinvestment was 3 to 3.5 times greater in communities such as Near-North, Phillips and Powderhorn compared to to better off communities like Southwest and Calhoun.
The data also reveals that annual NRP expenditures have been declining since the city took over the NRP program, despite the NRP fund balance of approximately $26m. This decline has been steepest in the most diverse and least affluent neighborhoods of the city, while annual expenditures have remained basically level or actually increased for the least diverse and most affluent neighborhoods.
The analysis suggests that the city's management of neighborhood programs results in structural racism.
What does the data say?
Part 1: Overall Disinvestment Through Funding Allocations
We showed in previous reports that the current funding allocations for Minneapolis neighborhood organizations is far from "equitable." Our current analysis shows the new funding allocations in fact result in significant disinvestment in the most diverse and least affluent neighborhoods in the City.
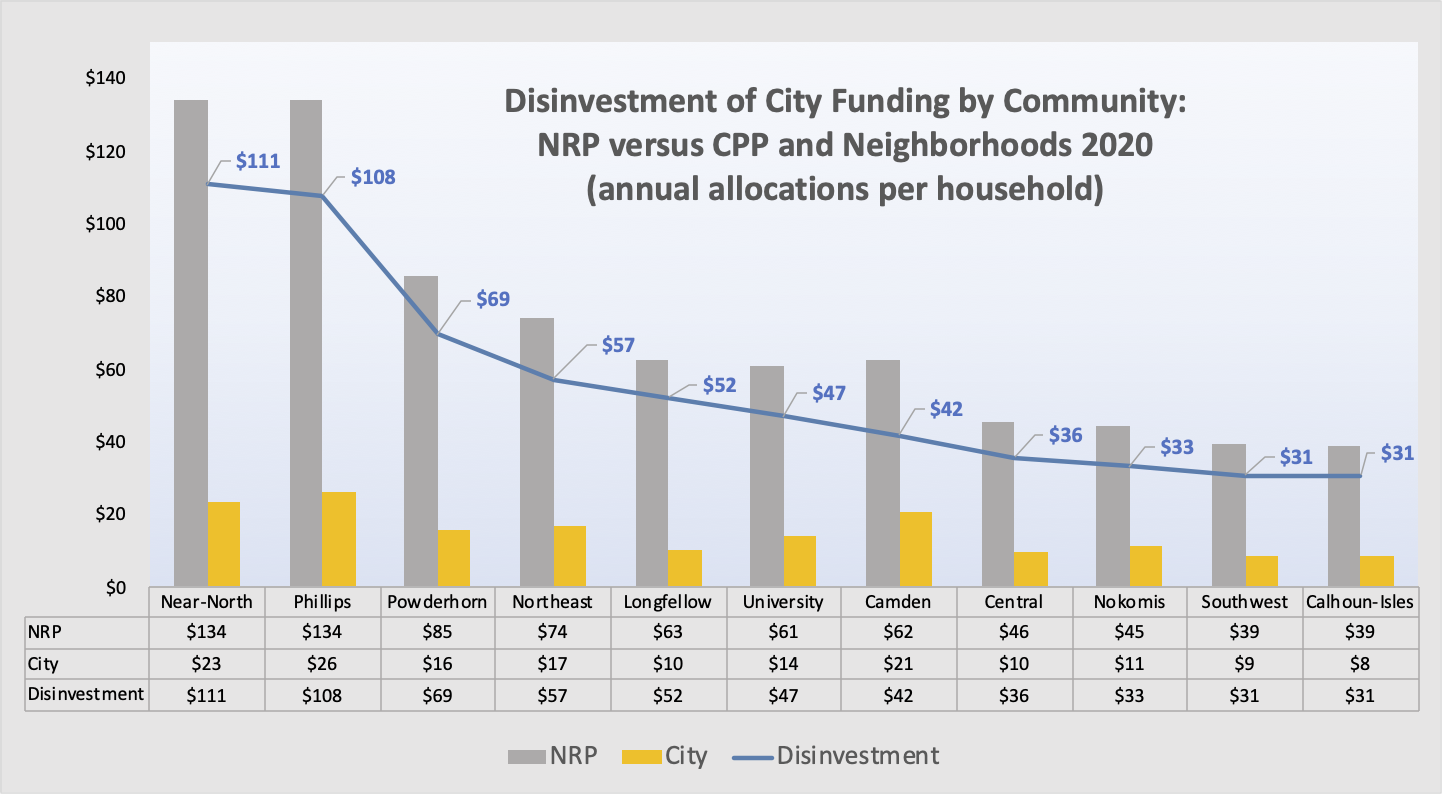
We compared annual funding allocations by community per household for the twenty years of the NRP program to the 13 years of Community Participation Program funds and Neighborhoods 2020 funding. ("Communities are traditional groupings of several neighborhoods in the City, click here to see a map of Minneapolis community boundaries).
Chart 1 (below) shows that the greatest disinvestments occurred in the most diverse and lowest-income communities of the City. Disinvestment in communities such as Near-North, Phillips and Powderhorn were 3 to 3.5 times higher than better off communities such as Southwest and Calhoun-Isles.
Part 2: Disinvestment in the Most Diverse Communities by the City.
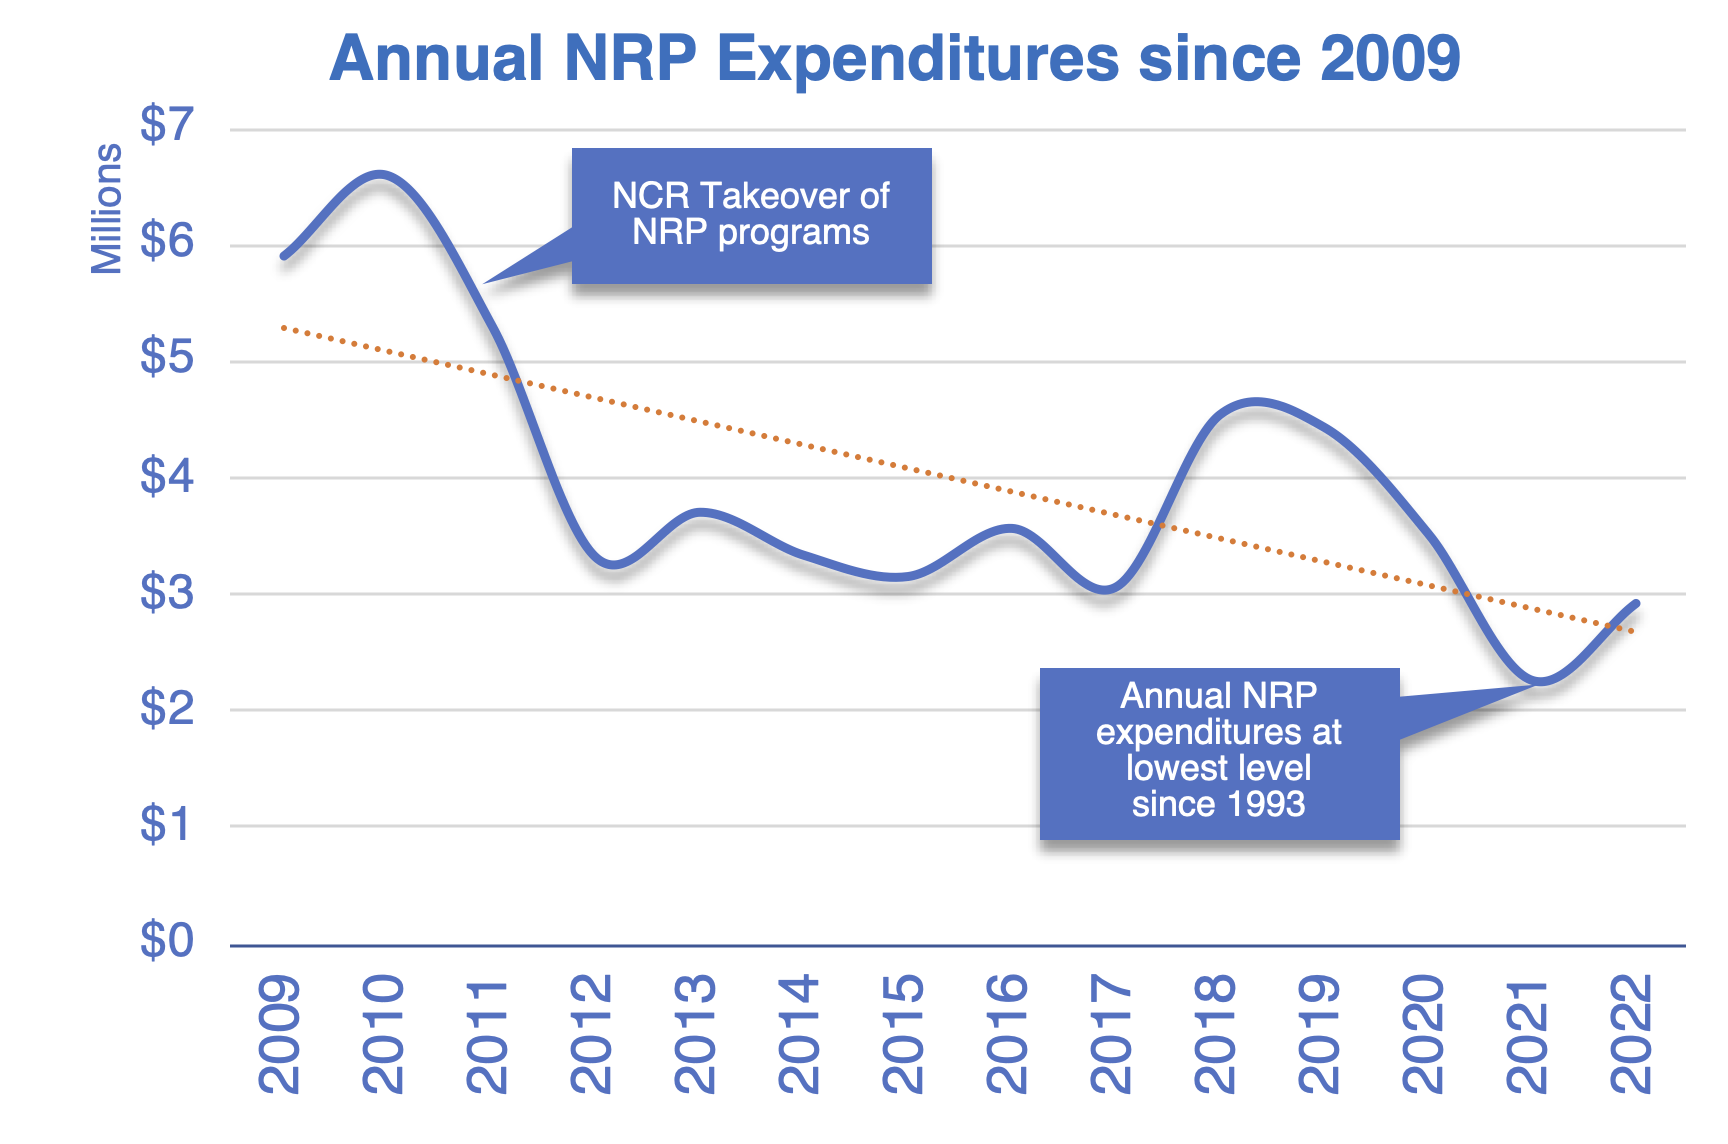
We also previously reported that annual expenditures of NRP funds have declined significantly since the City takeover of the NRP program. Chart 2 shows that this decline has been especially steep since 2018:
We did further analysis to determine what impact this might have on more diverse and less-affluent communities in Minneapolis.
The City and NCR fully took over the NRP program in 2012. The charts below show that the fall in annual NRP expenditures has hit the most diverse neighborhoods and lowest income neighborhoods hardest, while annual expenditures have actually increased for the least diverse and most affluent neighborhoods.
Chart 3 below compares average annual NRP expenditures for the twenty most diverse neighborhoods, compared to the twenty least diverse neighborhoods between 2014 and 2022.
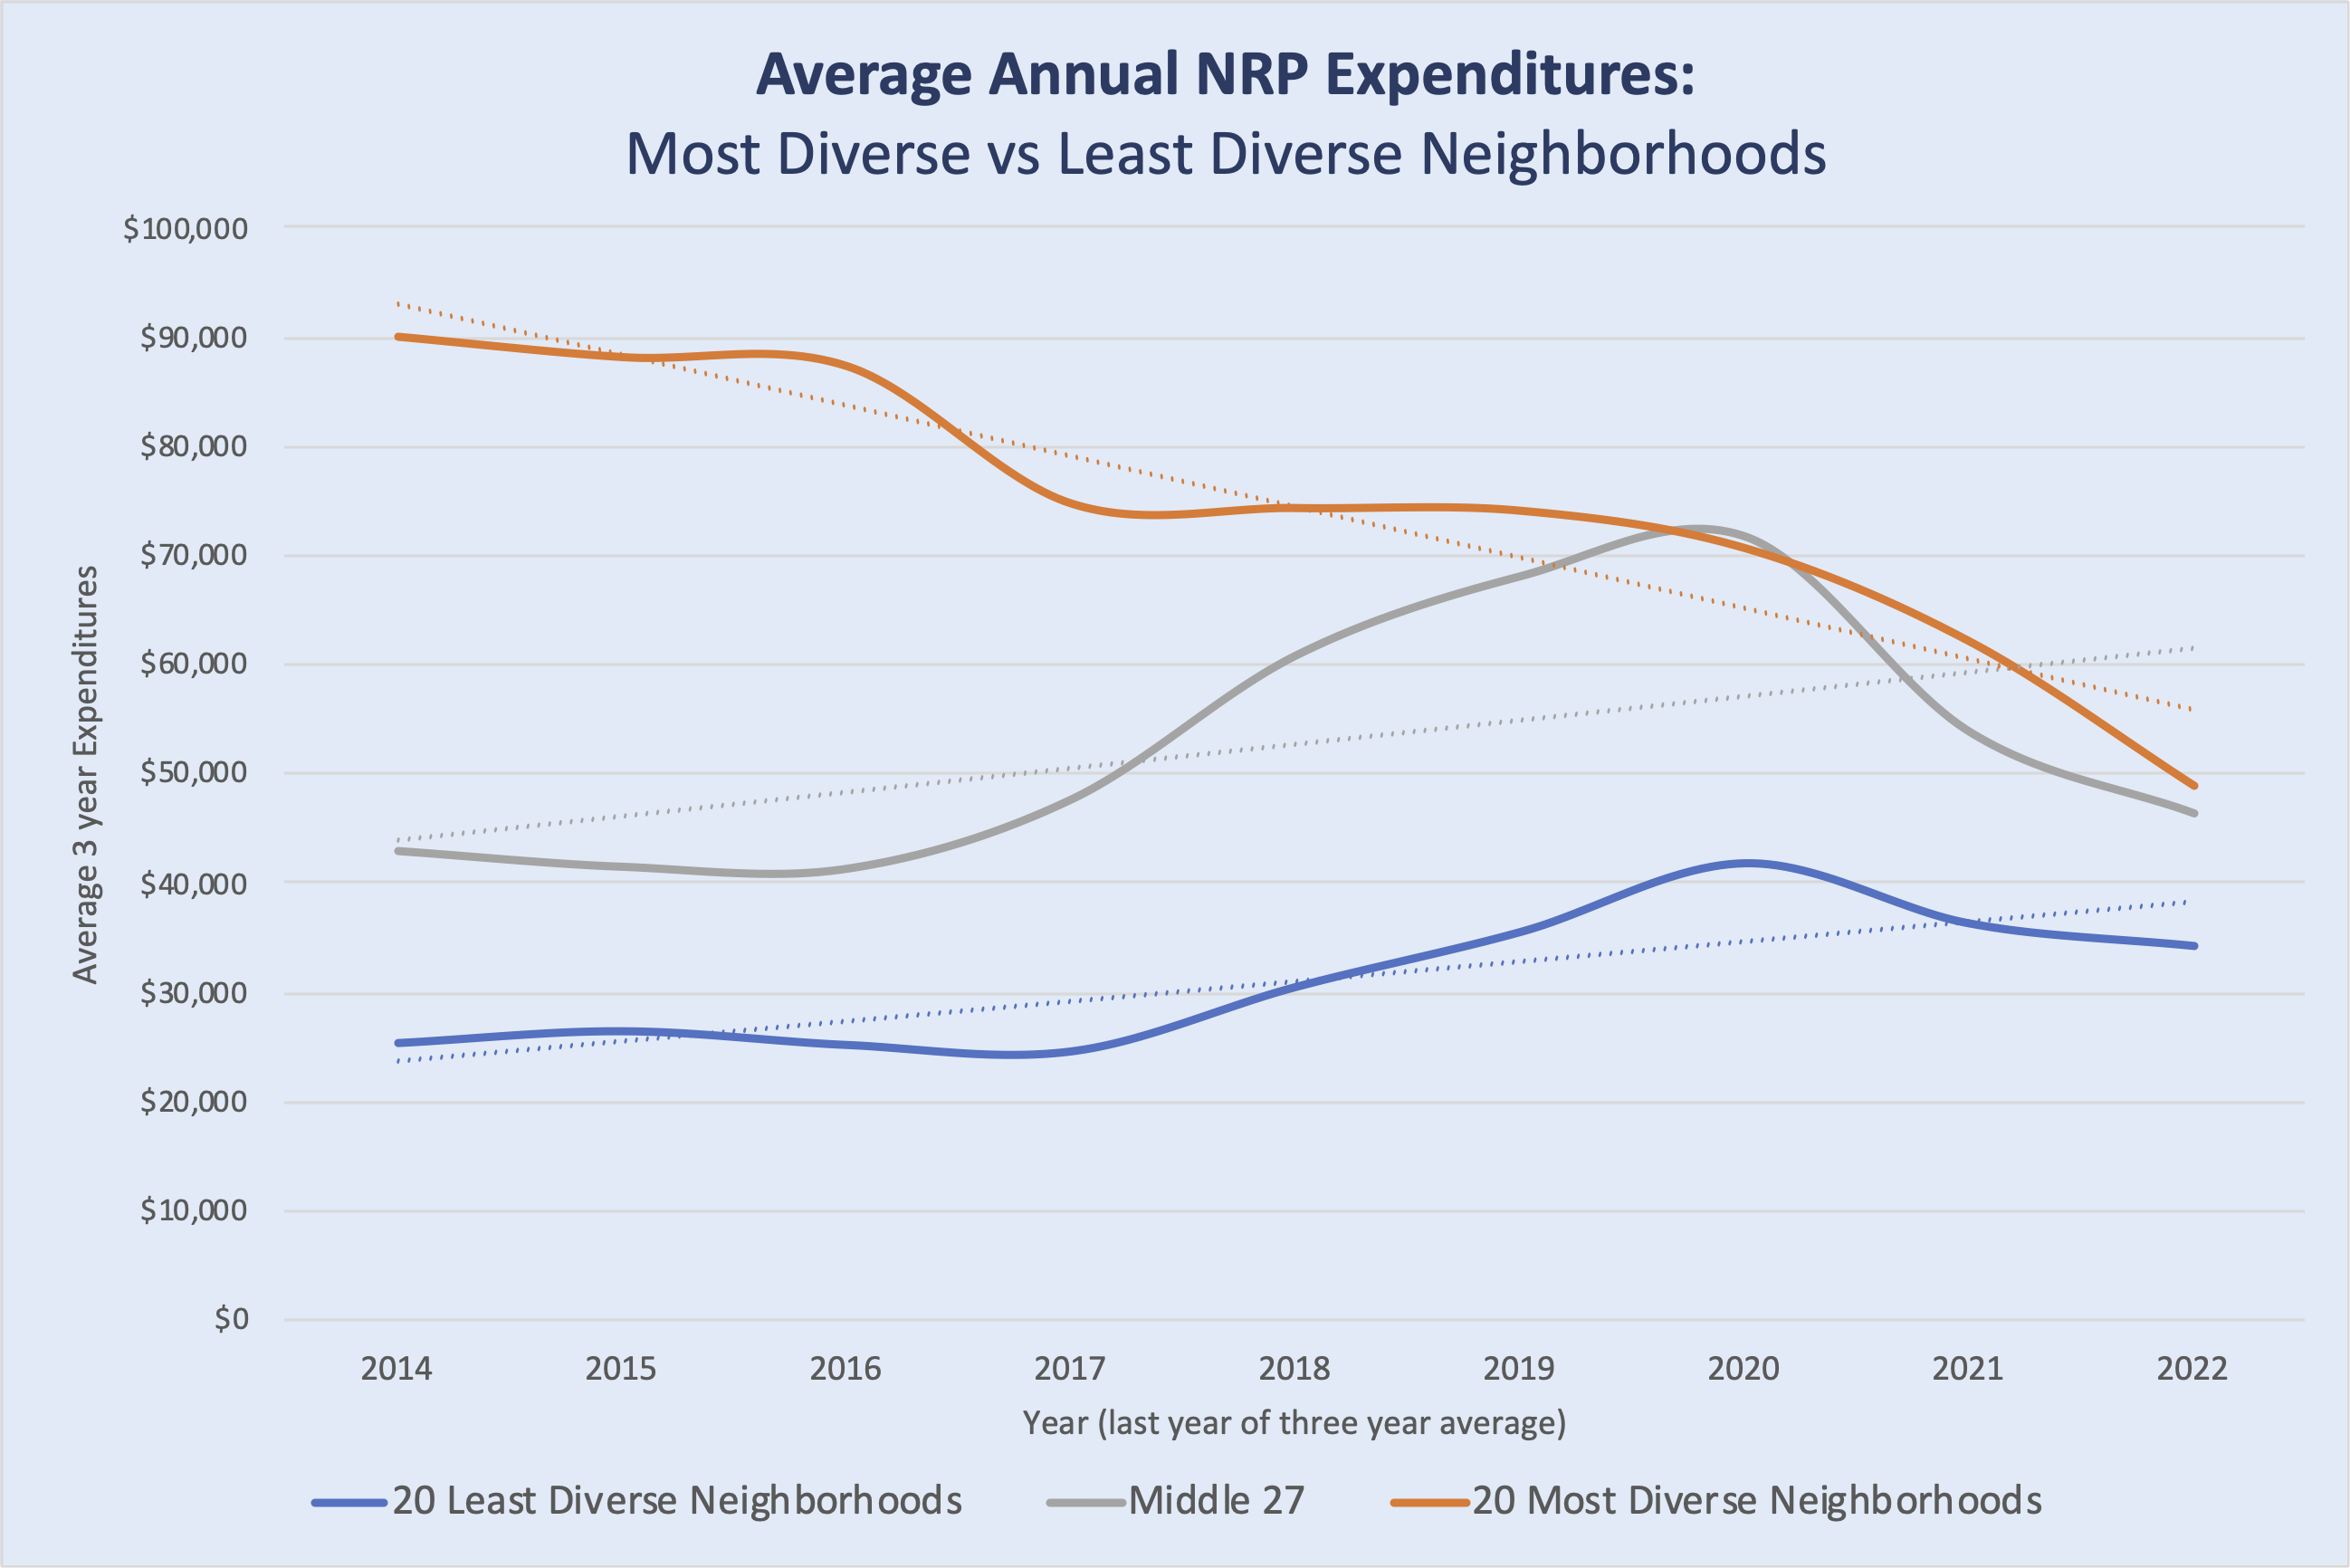
The chart at right compares the first three years of NRP expenditures under NCR compared to the last three years (2020 to 2022) of our study. The 20 least diverse neighborhoods saw an increase of annual NRP expenditures of 34.7%, while the 20 most diverse neighborhoods saw their annual expenditures plunge by 45.6% on average.
This cannot be blamed on lack of NRP funds: as of the end of 2022, the group of least diverse neighborhoods had combined NRP fund balances of just over $4.6 million while the group of most diverse neighborhoods had combined NRP fund balances of just over $11 million.

Part 3:Disinvestment in the Least Affluent Neighborhoods by the City.
We also compared annual NRP expenditures based on average household income per neighborhood.Chart 4 below compares average annual NRP expenditures for the twenty least affluent neighborhoods, compared to the twenty most affluent neighborhoods between 2011 and 2022.
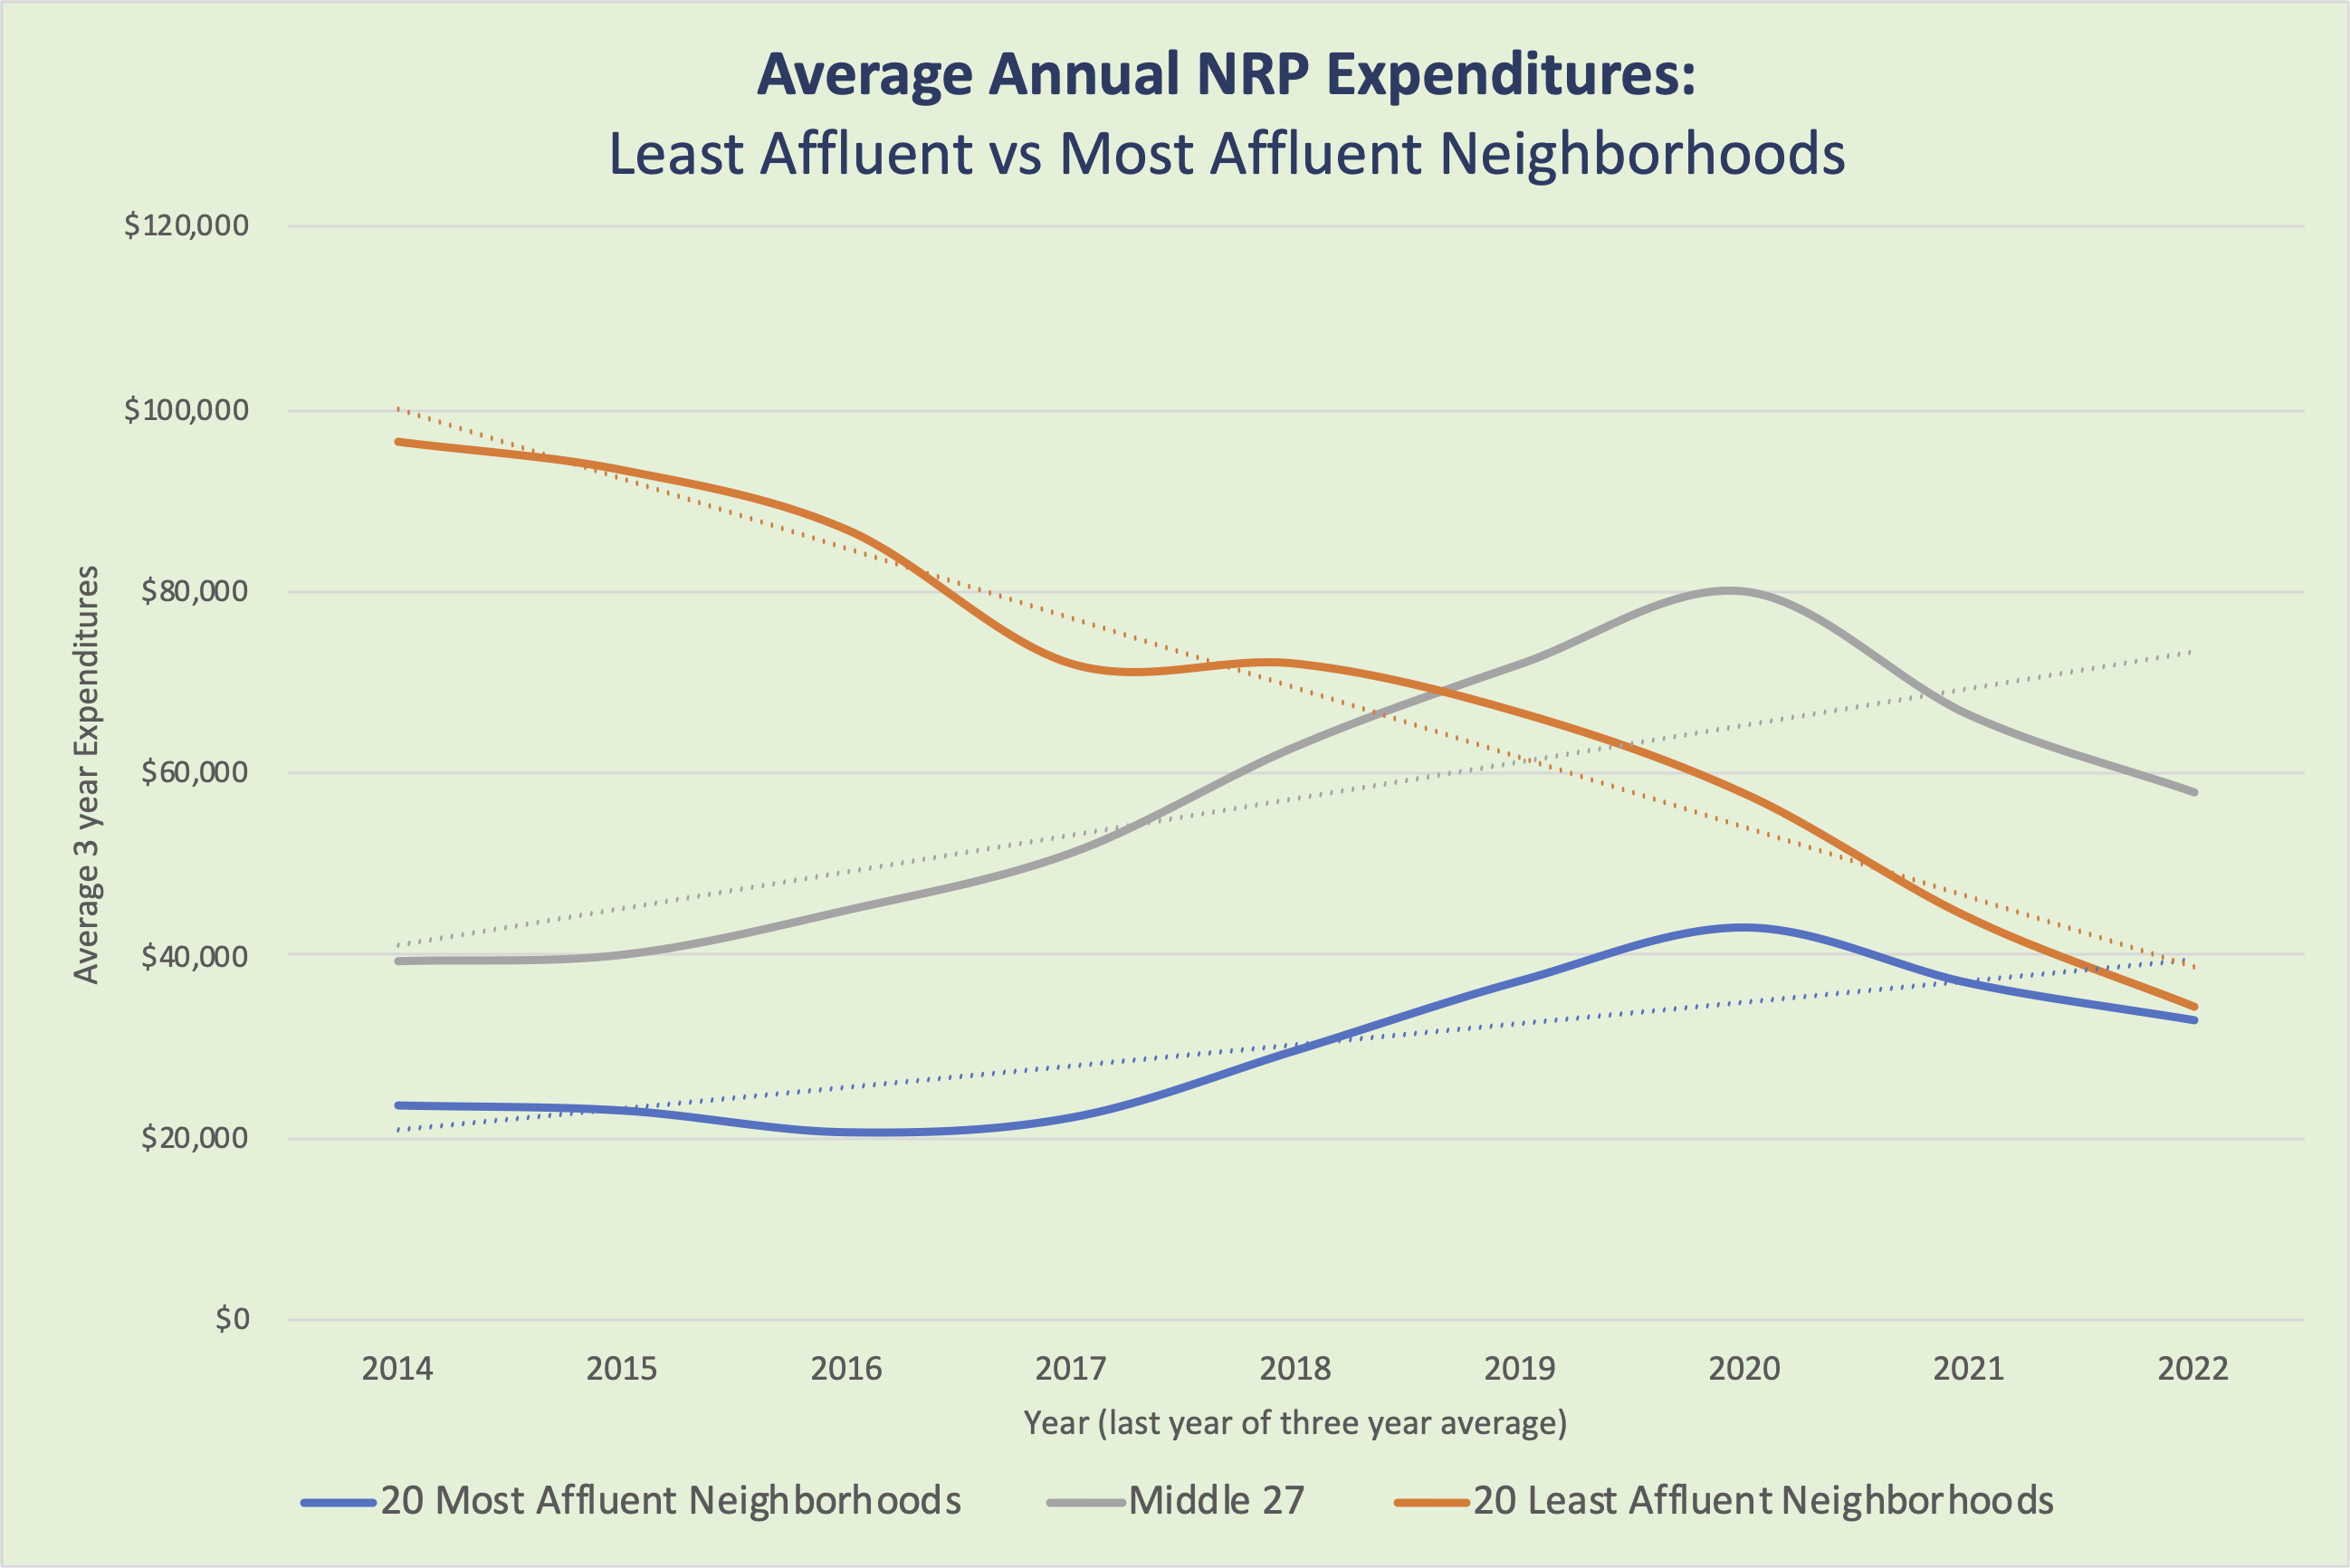
Average annual NRP expenditures decreased by over 53% for the 20 least affluent neighborhood in Minneapolis from 2012 to 2022. Average annual expenditures for the 20 most affluent neighborhoods increased by 27% during this same period.
The chart at right compares the first three years of NRP expenditures under NCR compared to the last three years of our study, 2020 to 2022. The 20 most affluent neighborhoods saw an increase of annual NRP expenditures of 39.6%, while the 20 least affluent neighborhoods saw their annual expenditures fall by 64.3% on average.
As above, this cannot be blamed on lack of NRP funds: as of the end of 2022, the group of most affluent neighborhoods had combined NRP fund balances of just over $4.1 million, while the group of least affluent neighborhoods had combined NRP fund balances of just over $10 million.

Part 4:Disinvestment in NRP Housing Programs by Race and Income
City leaders have also continued to claim that NRP housing programs "disproportionately benefited wealthier, whiter, homeowners—often at the expense of BIPOC renters." We have reported previously why these conclusions are inaccurate.
Much of CURA's and NCR's claims were based an analysis of a single set of data, provided by Center for Energy and the Environment.
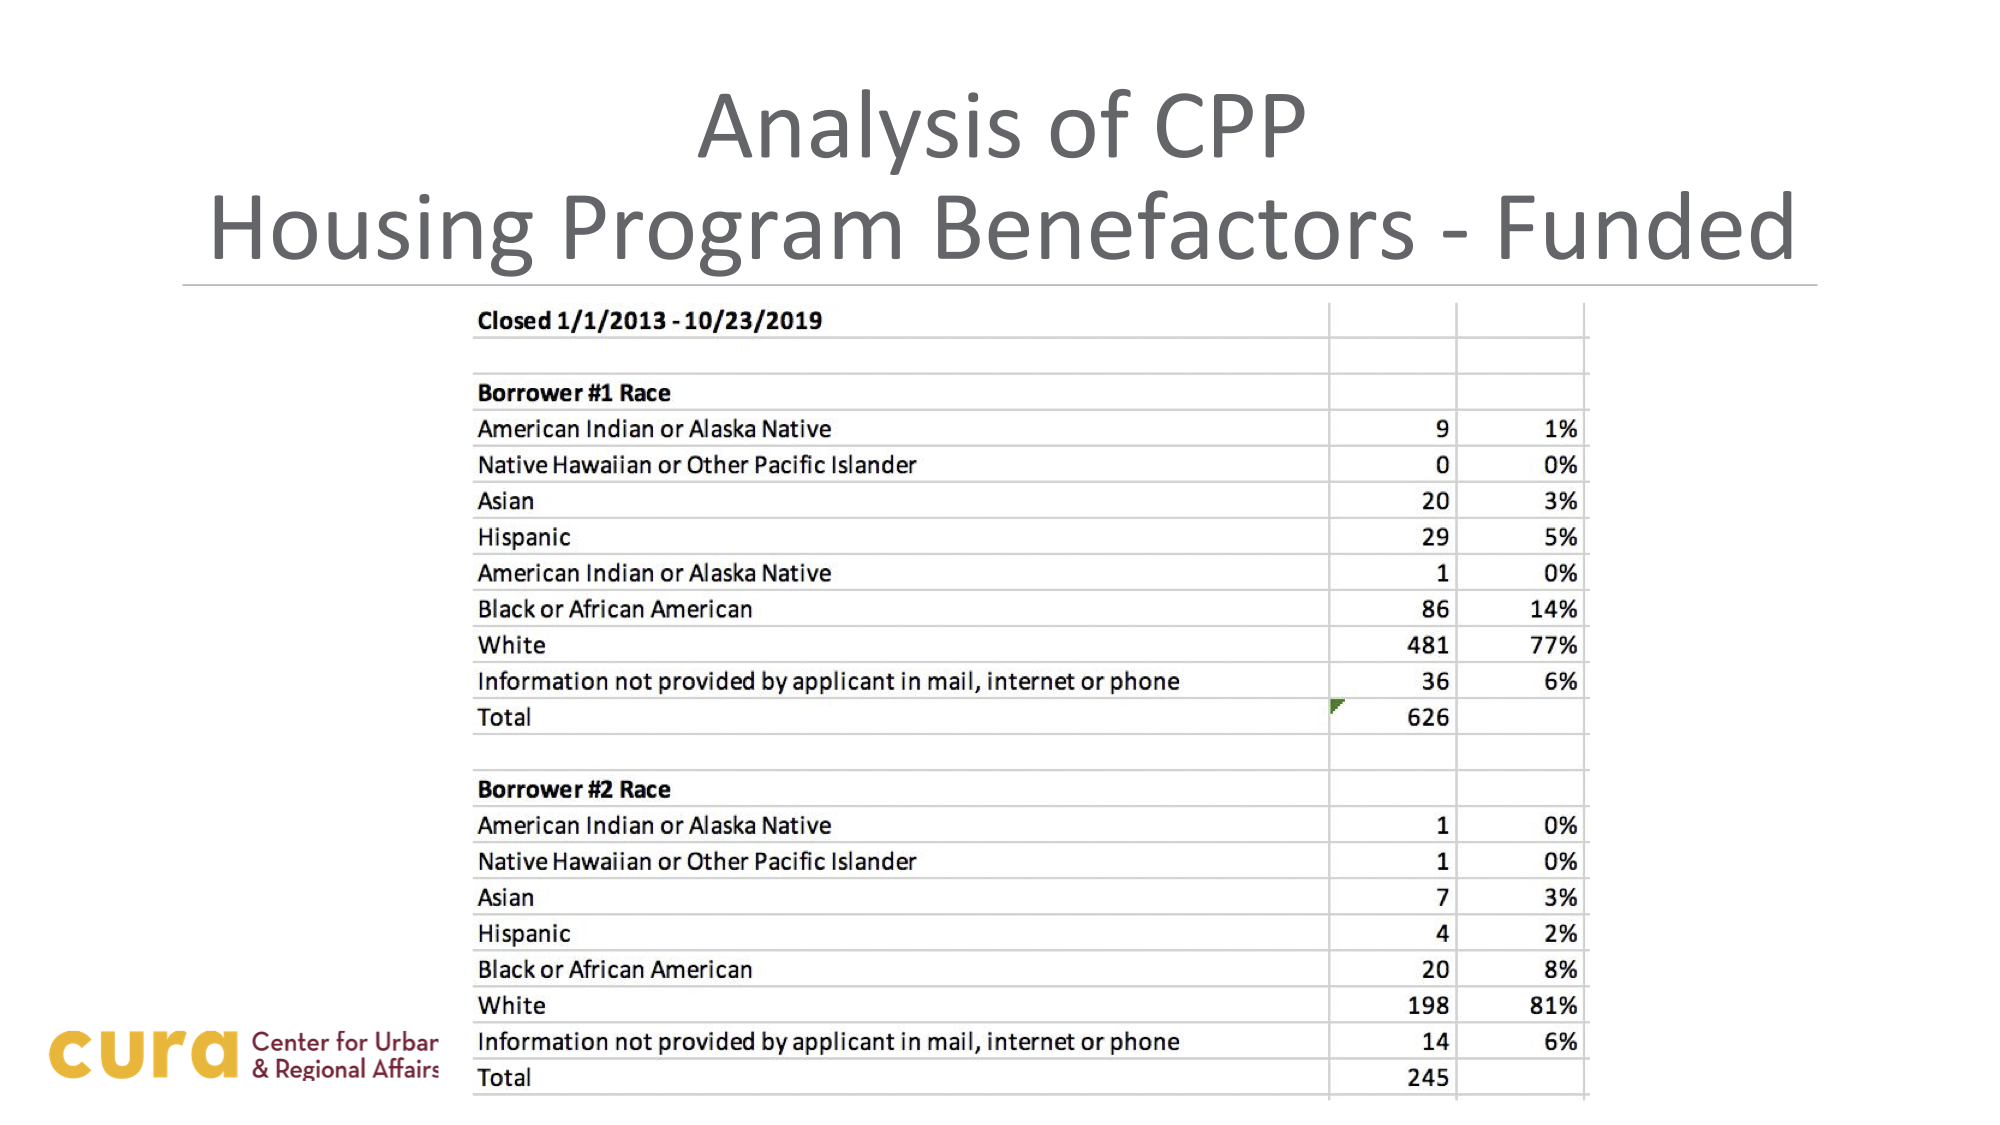
In our previous report, we highlighted several problems with relying on this data set to make conclusions about the NRP program, but this is the primary data used by CURA and NCR to claim that the NRP programs "disproportionately benefited wealthier, whiter, homeowners—often at the expense of BIPOC renters." Among those problems were that the data set was neither valid nor reliable, since it was only a very small sampling of data taken years after the heart of the NRP program (the vast bulk of NRP expenditures occured in the 1990s). It also did not represent the many other types of NRP programs carried out by neighborhoods, as reported in many previous studies of NRP. Regardless, this is the core set of data CURA and NCR relied on.
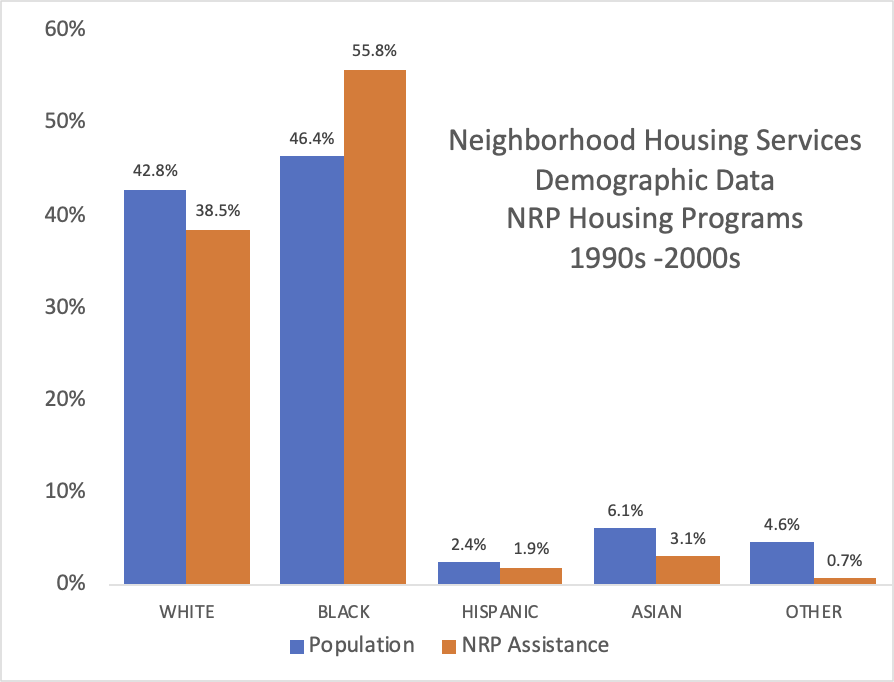
We reported on another set of data is arguably more valid and reliable, the data collected by Neighborhood Housing services during the 1990s. We argued that this was both more valid and more reliable since it was sampled during the 1990s (when NRP expenditures were at their highest) and at a time when there were several housing agencies operating in Minneapoils with similar practices to NHS (including CEE).
We were able to recently recover Census data from the 1990s that provided race and household income data by neighborhood, and carried out an analysis comparing the NHS data to race and average household income for the actual neighborhoods served by NHS during those years. Chart 7 compares NHS demographic data with demographics of the neighborhoods actually served by NHS in the 1990s and early 2000s:
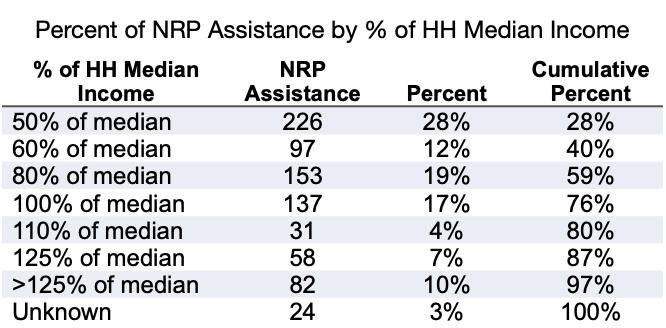
The NHS data also provides a breakdown of NRP housing assistance compared to recipients' income. Chart 8 below shows that 76% of those receiving NRP assistance from NHS were at 100% of household median income or below.
Part 5: Analysis
If space aliens landed at the South Pole, they would likely fly straight home having concluded that the Earth was a frozen, windy, and uninhabitable wasteland. But the South Pole is not representative of the Earth as a whole. As those of us with real experience know, there are many diverse continents, each with its own unique ecosystems, climates and cultures.
It is for this reason that we questioned the validity of CURA's study and the City's claims. For a study to be valid, the data should be gathered from a population that is representative of the community you are studying. But CURA's study failed to do so... by ignoring other data and studies, it was the equivelant of landing on the South Pole. As many other studies of NRP have concluded, the housing programs managed by agencies such as CEE or NHS were only one slice of a much bigger pie.
There is, indeed, an irony of CURA's use of the CEE data set to make the claim that the NRP was an example of systemic racism, since the CEE data comes from a period after the City takeover of the NRP program.
After the City takeover of the NRP program, the data shows a routine pattern of disinvestment in the most diverse and least affluent neighborhoods. The data also shows that this happens at several levels of the City's management of neighborhood programs:
- The City's overall funding allocations since the takeover of the NRP program: the more diverse your neighborhood the greater the disinvestment. The less affluent, the greater the disinvestment. This is despite CURA's claims that the Community Participation Program was more equitable than NRP.
- Actual expenditures of NRP funds fell immediately following the City's takeover of the NRP Program, and fell especially over the last five years to historic lows. As above, the more diverse your neighborhood, the more your NRP expenditures fell. The less affluent your community, the more your annual expenditures fell. This is not for lack of funds, since the more diverse and less affluent neighborhoods have, on average, more available NRP funds.
- NRP housing expenditures have also been less than equitable since the City takeover of the NRP program. The data clearly shows that, during the core NRP years, Black households received disproportionately more NRP assistance than white households.
- The NHS data also shows that, before the City takeover, the preponderance of NRP housing assistance went to lower income families.
It is past time for the City stop this charade, especially because it is clearly causing harm to the most diverse and low-income neighborhoods of the City. If, by the standards that CURA set in its study, the data shows that NRP was an example of structural racism, what does this say about the City's management of neighborhood programs?