NCR has failed to help neighborhood organizations utilize NRP funds
Background on NRP Fund Balances
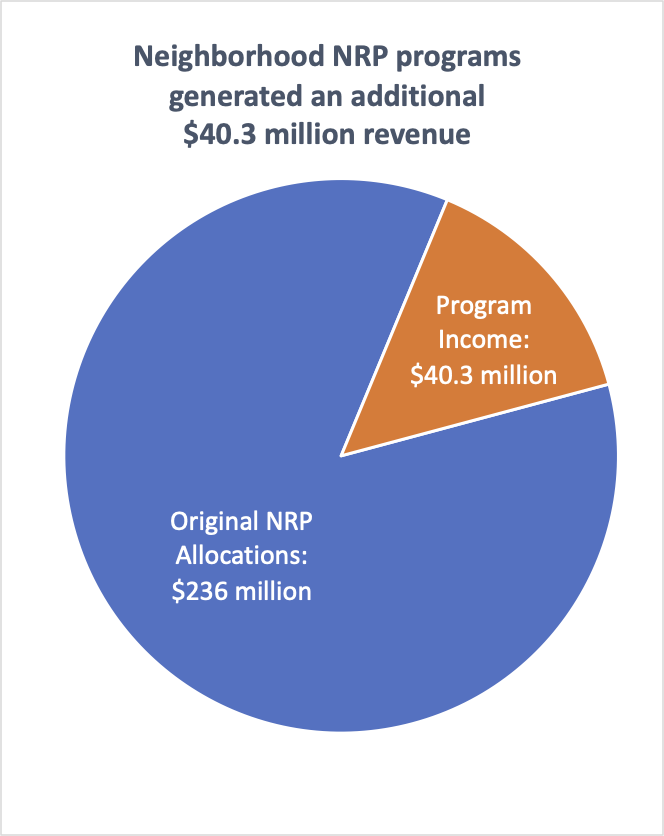
- Over more than 30 years, neighborhood NRP programs generated an additional $40.3 million in program income.
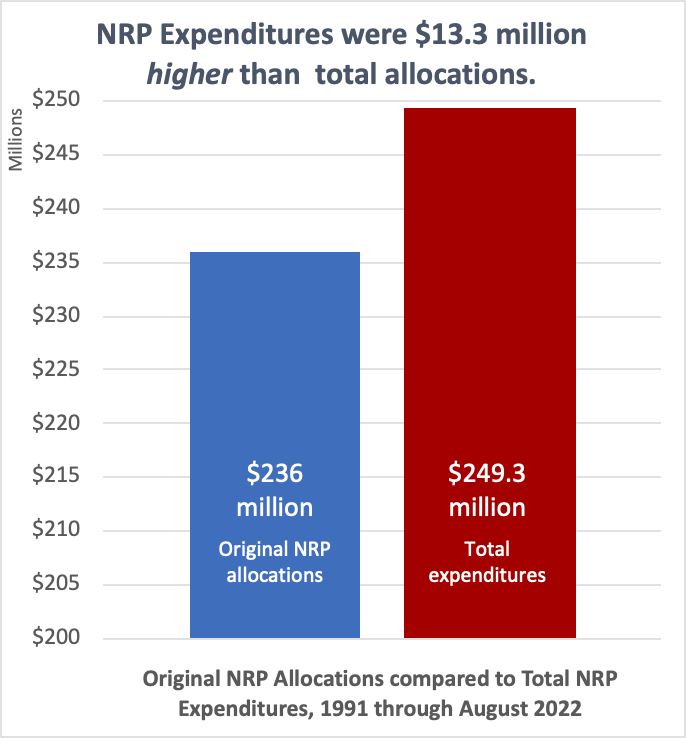
- Original Phase I and Phase 2 Neighborhood NRP expenditures were actually $13.3 million more than original allocations.
- Neighborhood NRP programs generated $40.3 million in additional revenue over 30 years. This is called “program income.”
- In five years from 2015 through 2019, NRP expenditures were $18.8 million. Program income was $10.7 million, offsetting more than half of all expenditures.
- City and NRP deliberately slowed pace of expenditures in Phase 2.
- 2001 State tax reform legislation significantly reduced revenues for NRP Phase 2.
- NRP and City deliberately capped NRP expenditures.
- This delayed rate of expenditures in 2000s.
- Neighborhood organizations had no control over this.
- City Council reallocated $10 million of NRP funds in 2010.
- This significantly slowed down rate of Phase 2 expenditures in 2010s.
- The funds were restored by City Council action in 2017.
- Neighborhood organizations had no control over this.
- Housing Vendor Changes from 2014 to 2016
- Due to increasing costs of administering NRP and City home loan and grant programs, CEE significantly increased admin fees in 2014. Many neighborhoods dropped CEE and re-contracted with GMHC.
- In 2016, GMHC announced it was getting out of loan and grant business because it was losing too much money. Many neighborhoods re-contracted all over again.
- Neighborhood organizations had no control over this.
(NRP RCA, December 8, 2009)
(NRP Policy Board Staff Report, March 29, 2017)
Data above is based on NRP Phase 1 and Phase 2 funds. CPP funds are not included.